Spot the unexpected. Mitigate the unplanned.
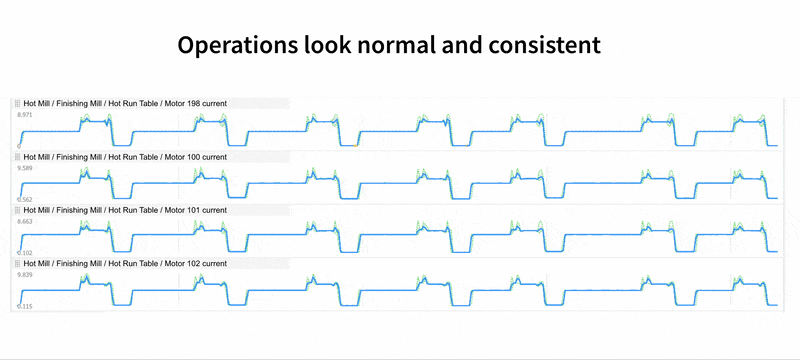
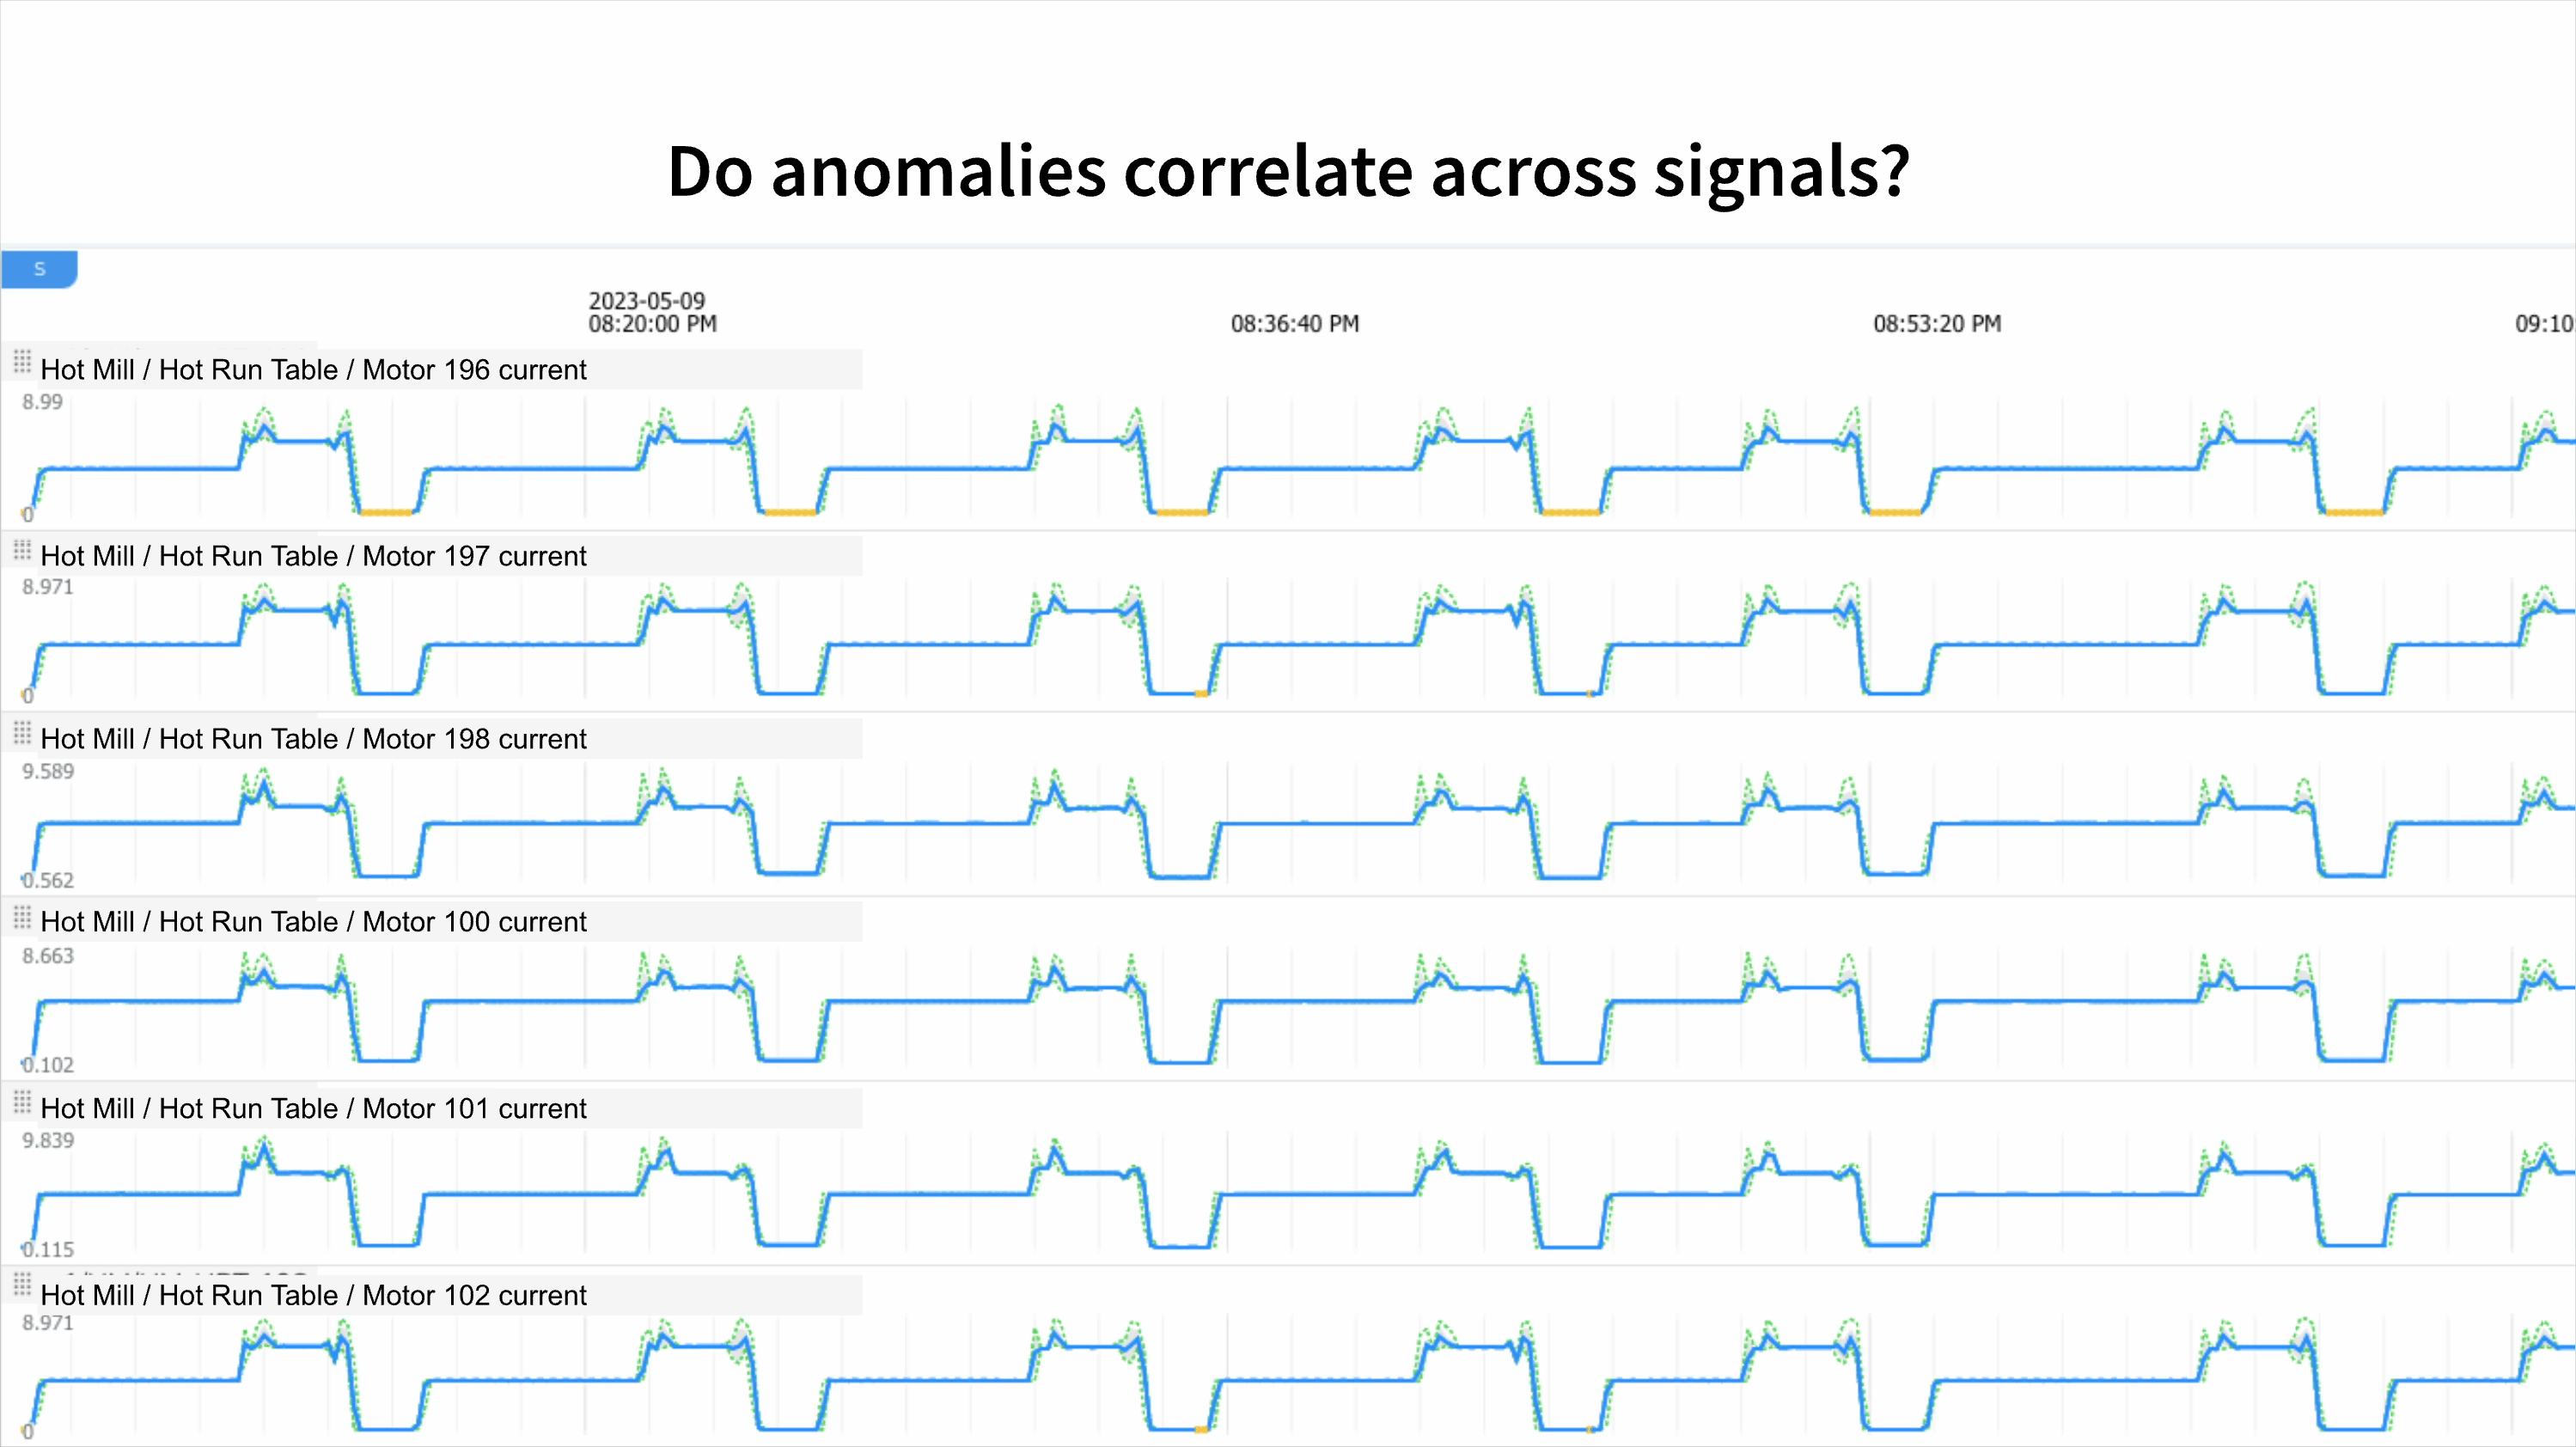
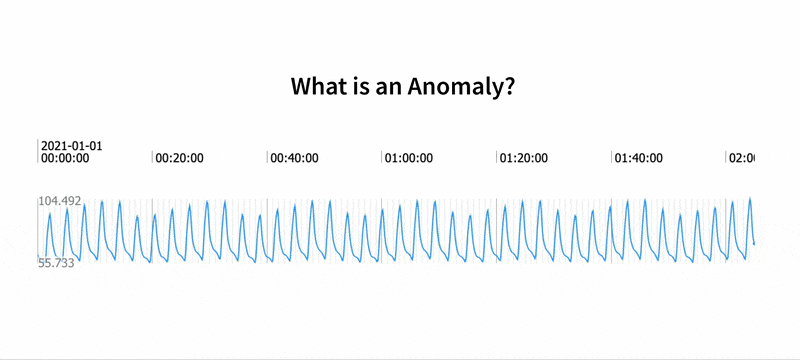
Anomalies reveal the first signs of trouble. Detecting them reliably means that your operations and design teams have real-time visibility and can speed up their actions. If you can do this without data science training or pre-judged correlations, then you can transform your enterprise.
'%3e%3cpath%20fill='%23000000'%20fill-opacity='0.0'%20d='m0%200l1152.0%200l0%20864.0l-1152.0%200z'%20fill-rule='evenodd'/%3e%3cpath%20fill='%23cfe2f3'%20d='m10.446195%2051.183727l15.6692915%20-32.377953l15.669292%2032.377953z'%20fill-rule='evenodd'/%3e%3cpath%20stroke='%234a86e8'%20stroke-width='1.0'%20stroke-linejoin='round'%20stroke-linecap='butt'%20d='m10.446195%2051.183727l15.6692915%20-32.377953l15.669292%2032.377953z'%20fill-rule='evenodd'/%3e%3cpath%20fill='%23d9d2e9'%20d='m50.149643%2031.17302l17.76374%20-12.367245l17.76374%2012.367245l-6.785141%2020.010624l-21.957195%200z'%20fill-rule='evenodd'/%3e%3cpath%20stroke='%239900ff'%20stroke-width='1.0'%20stroke-linejoin='round'%20stroke-linecap='butt'%20d='m50.149643%2031.17302l17.76374%20-12.367245l17.76374%2012.367245l-6.785141%2020.010624l-21.957195%200z'%20fill-rule='evenodd'/%3e%3cpath%20fill='%23d9ead3'%20d='m7.3122435%2088.73061l3.5184107%20-14.409599l14.2454605%20-6.41288l14.245464%206.41288l3.5184097%2014.409599l-9.858292%2011.555649l-15.811163%200z'%20fill-rule='evenodd'/%3e%3cpath%20stroke='%2300ff00'%20stroke-width='1.0'%20stroke-linejoin='round'%20stroke-linecap='butt'%20d='m7.3122435%2088.73061l3.5184107%20-14.409599l14.2454605%20-6.41288l14.245464%206.41288l3.5184097%2014.409599l-9.858292%2011.555649l-15.811163%200z'%20fill-rule='evenodd'/%3e%3cpath%20fill='%23fce5cd'%20d='m52.244095%2084.097115l0%200c0%20-8.940926%207.015381%20-16.18898%2015.669289%20-16.18898l0%200c4.155754%200%208.141304%201.7056198%2011.0798645%204.741646c2.9385605%203.0360184%204.589432%207.1537476%204.589432%2011.447334l0%200c0%208.940926%20-7.015381%2016.188972%20-15.669296%2016.188972l0%200c-8.653908%200%20-15.669289%20-7.248047%20-15.669289%20-16.188972z'%20fill-rule='evenodd'/%3e%3cpath%20stroke='%23ff9900'%20stroke-width='1.0'%20stroke-linejoin='round'%20stroke-linecap='butt'%20d='m52.244095%2084.097115l0%200c0%20-8.940926%207.015381%20-16.18898%2015.669289%20-16.18898l0%200c4.155754%200%208.141304%201.7056198%2011.0798645%204.741646c2.9385605%203.0360184%204.589432%207.1537476%204.589432%2011.447334l0%200c0%208.940926%20-7.015381%2016.188972%20-15.669296%2016.188972l0%200c-8.653908%200%20-15.669289%20-7.248047%20-15.669289%20-16.188972z'%20fill-rule='evenodd'/%3e%3c/g%3e%3c/svg%3e)